
Max-Planck-Institut für Biogeochemie
Ort
Seminarraum C2.011
Hans-Knöll. Str.10
Interactive Data Visualizations
In our Data Visualization Project we want not only do reasearch via Visual Analytics but also support scientific communication and dissemination. Our animations, interactive apps and high quality images are mostly using data generated by our research groups and measuring stations. They allow to visualize huge and complex data sets. We are happy to share our colorful images and the insights that we can gain from it.
Bild
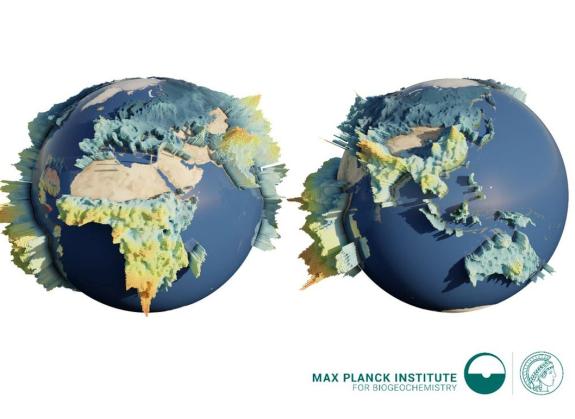
Ecosystem Carbon Decomposition Rate
, ©
Jeran Poehls & Lazaro Alonso
Standort
#LNDWJena
Lange Nacht der Wissenschaften 2022 wird gefördert und unterstützt durch:
![]()
![]()
![]()